How to transform yet another management-provided tool into a resource that gives employees a sense of ownership in making their workplace better?
My role as a product designer on the project was to co-create the product roadmap, take over the existing analytics across various platforms, facilitate workshops and create designs aligned with the company’s established brand direction.
I was responsible for co-creating the product roadmap and leading end-to-end design, from user research to visual execution, shaping a seamless and impactful user experience.
Our mission was to promote ideas that enable employees to improve their working conditions while also driving higher business performance for the stores. The platform serves as a space where these ideas can be published and promoted, allowing every store employee worldwide to discover and apply improvements.
HOW DID WE RAISE IMPROVEMENT SUBMISSION TO 181%?
HOW DID WE DECREASE VALIDATION TIME?
With the help of Power BI analytics and all validation stakeholders, we managed to reduce the validation time by 38,4%.
The answer to further reduce validation time? Submission flow
In one year, we achieved a 181% increase in submitting high quality improvements.
Together with the stakeholders, we began shaping a product roadmap that initially focused on improving the validation process: the procedure followed when a store employee submits an improvement.
This process involves an editor, who reviews the submission for content and language and serves as the first point of contact with the submitter.
The editor then works together with subject matter experts in the relevant fields, who verify the accuracy of the provided KPIs and suggest further improvements. They also ensure that all necessary data is included and that the submission complies with IKEA concept
When we started working on the validation process, the editors and subject matter expert were working together manually in an Excel file, which created a immense pain point.
Below is an image of the user flow, displaying the submission flow, validation flow which ends with successfully submitting an improvement.
The entire process, from product discovery through to implementation, took around seven months.
After reducing the validation time, we noticed that a major source of friction in the process was the first step: the communication between the editor and the submitter. Research showed that 70% of submitted improvements had to be sent back to the submitter, and most took more than a week to receive a response. The most common reasons for this were incomplete form fields and a lack of clarity about what the form was asking for.
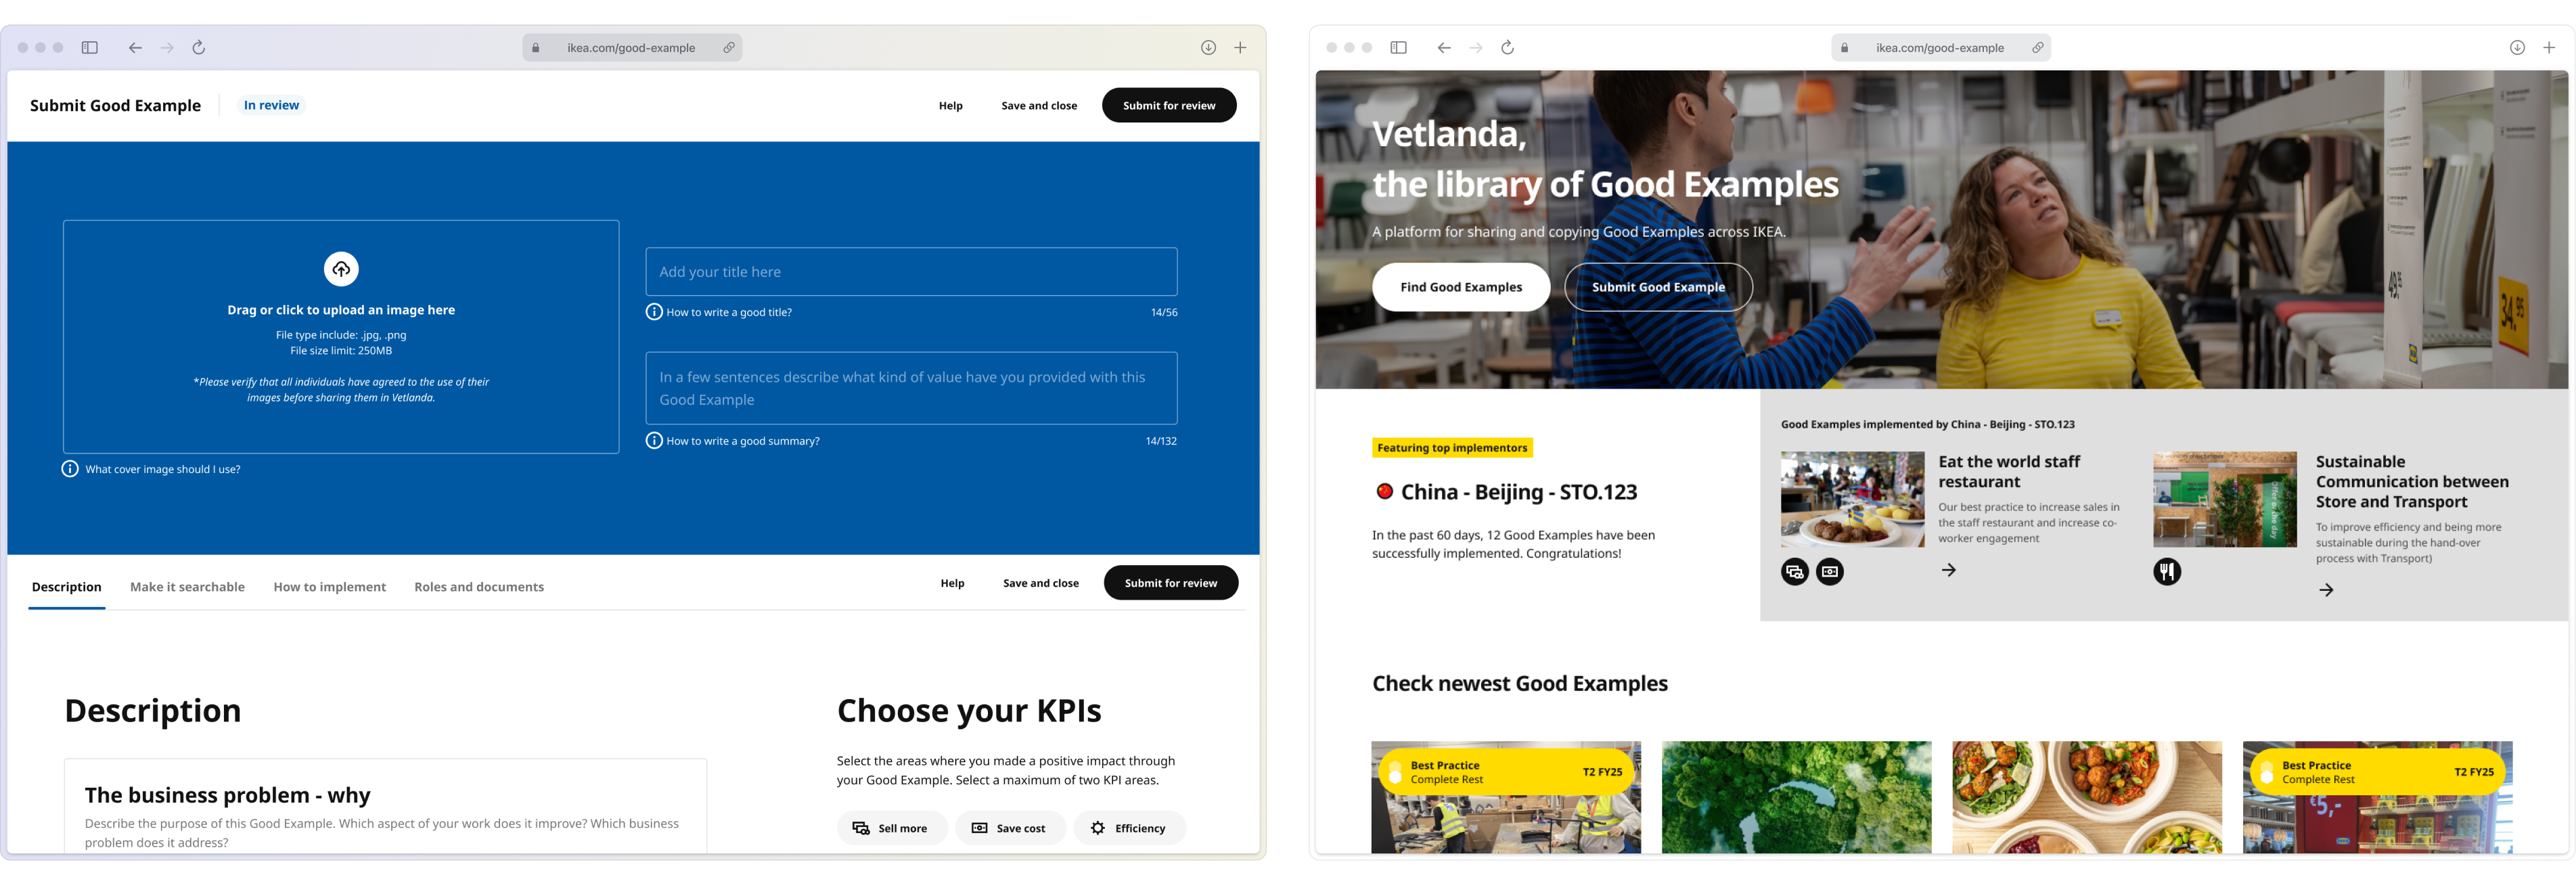
We shifted our focus to other aspects of the product, concentrating on improving the submission flow — the journey from when a store employee enters a proposal to when they click the button to submit it.
Work was done in the most crucial areas: we introduced new KPIs flow and introduced a new KPI selection that is frequently used by the stores. To create a seamless flow, we conducted remote interviews with store employees from around the world. After synthesising the findings, we ran workshops with stakeholders to finalise the iterations.
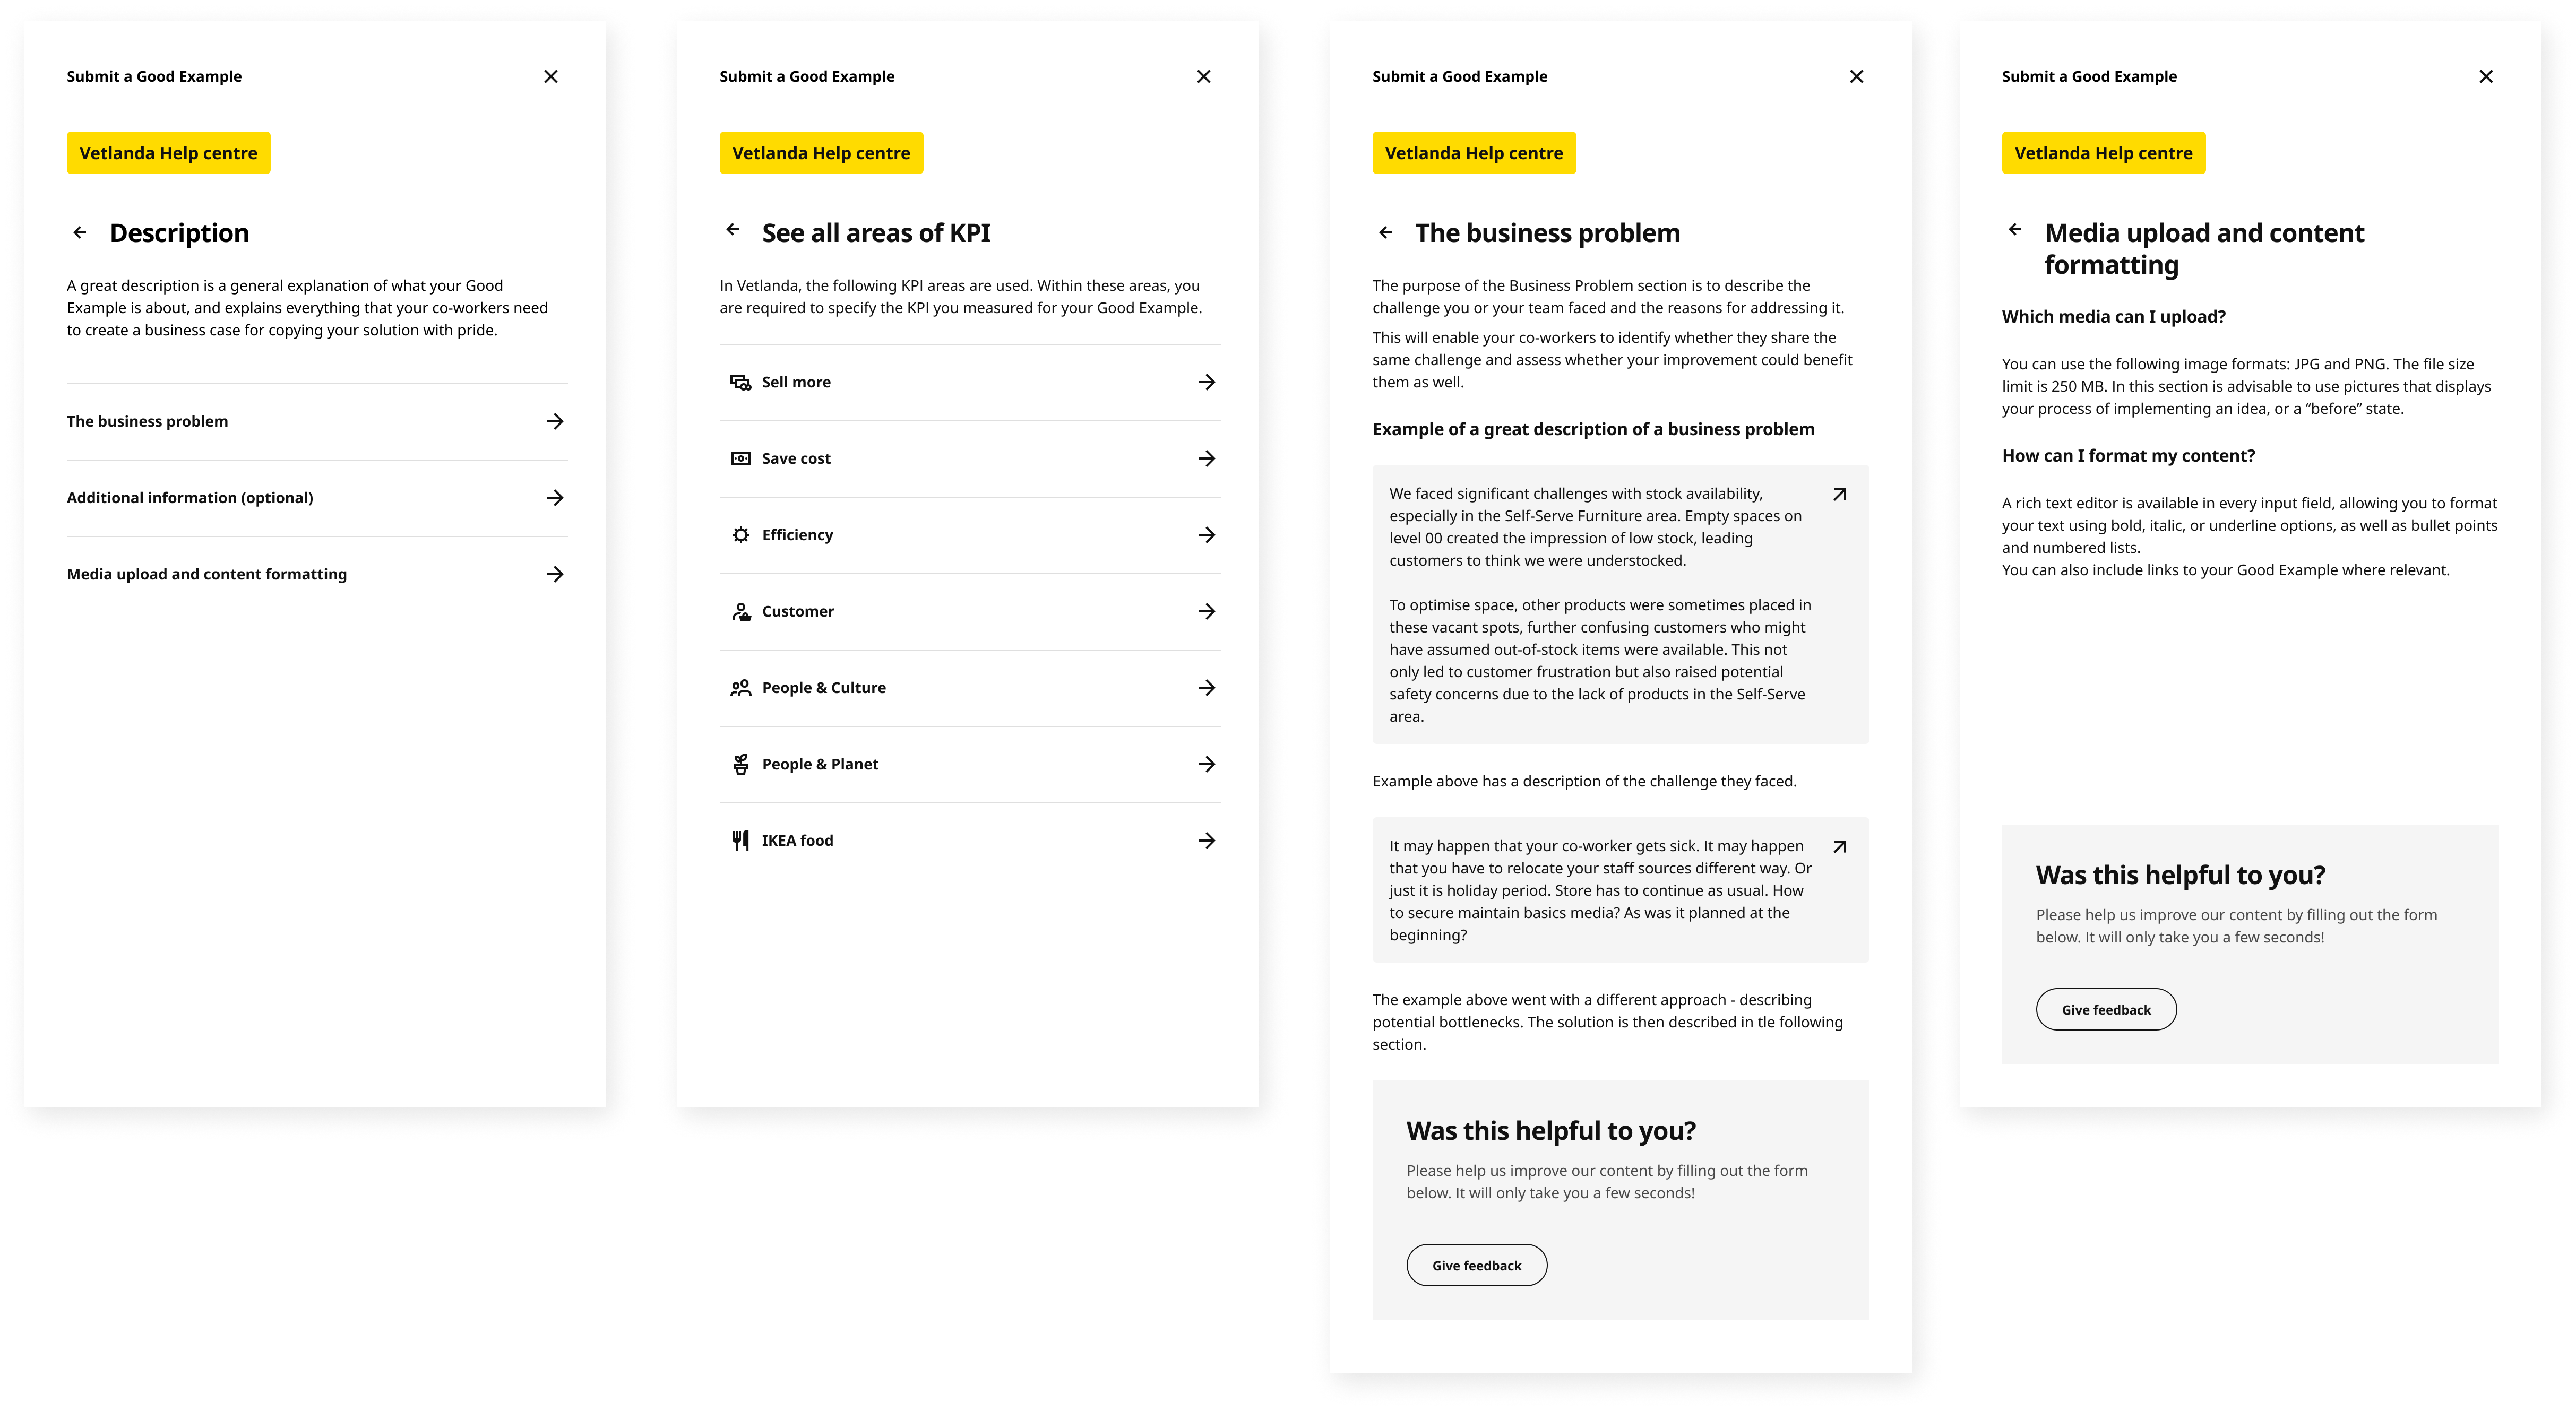
We also revamped the help centre and reduced the number of input fields following recurring collaboration with the editors.
In parallel, we have improved the submission flow with the feedback from the editors as well, as they are the first contact after an improvement is submitted. They have a great overview on how the submission form is used.
Improving the submission form had a positive impact not only on the validation of improvements but also on the overall use of the platform. The published improvements became higher in quality, clearer, and more concise, which led to store employees developing greater trust in them over time. As more employees adopted existing improvements, they also became more motivated to submit their own.

HOW DID WE RAISE NUMBER OF IMPLEMENTATIONS?
We managed to get people to share, but what about copying improvements?
In 84% of the time, store employees want to find ways to improve store performance only within their particular review area.
In this project, I learned a great deal about co-creating a product roadmap and organising work into epics and stories in Jira. It was an important lesson in collaborating with stakeholders, as working closely with them was a key part of the process.
As a product designer, I was responsible for driving the redesign of IKEA’s design system components on the product roadmap. I was a strong advocate for this, as I recognised that with the number of features we had planned, we would face a significant UI debt if we did not address this issue.
When the project initially began, IKEA did not have a design system in place, but now it does, and it is mandatory for all internal products to use the design system. This presented several challenges because many of the components provided by the design system were not yet implemented in the Vue library we were using.
While designing, I had to constantly balance the components available in the Vue library with the need to create designs that were both user friendly and resource efficient.
Despite these challenges, the most rewarding aspect of the project is that, in the future, we will be able, with the help of AI, to calculate precisely how much profit an individual improvement has generated for the company.
Tradeoffs for tech debit in product roadmap
Over the past year, we put significant effort into improving the validation process and the submission form, ensuring that store employees could easily access the form, enter their information without difficulty, and have their submissions published as quickly as possible. Now, our focus has shifted to enhancing and managing the other side of Vetlanda: encouraging employees to adopt proven improvements already available on the platform.To address this, we carried out extensive research.
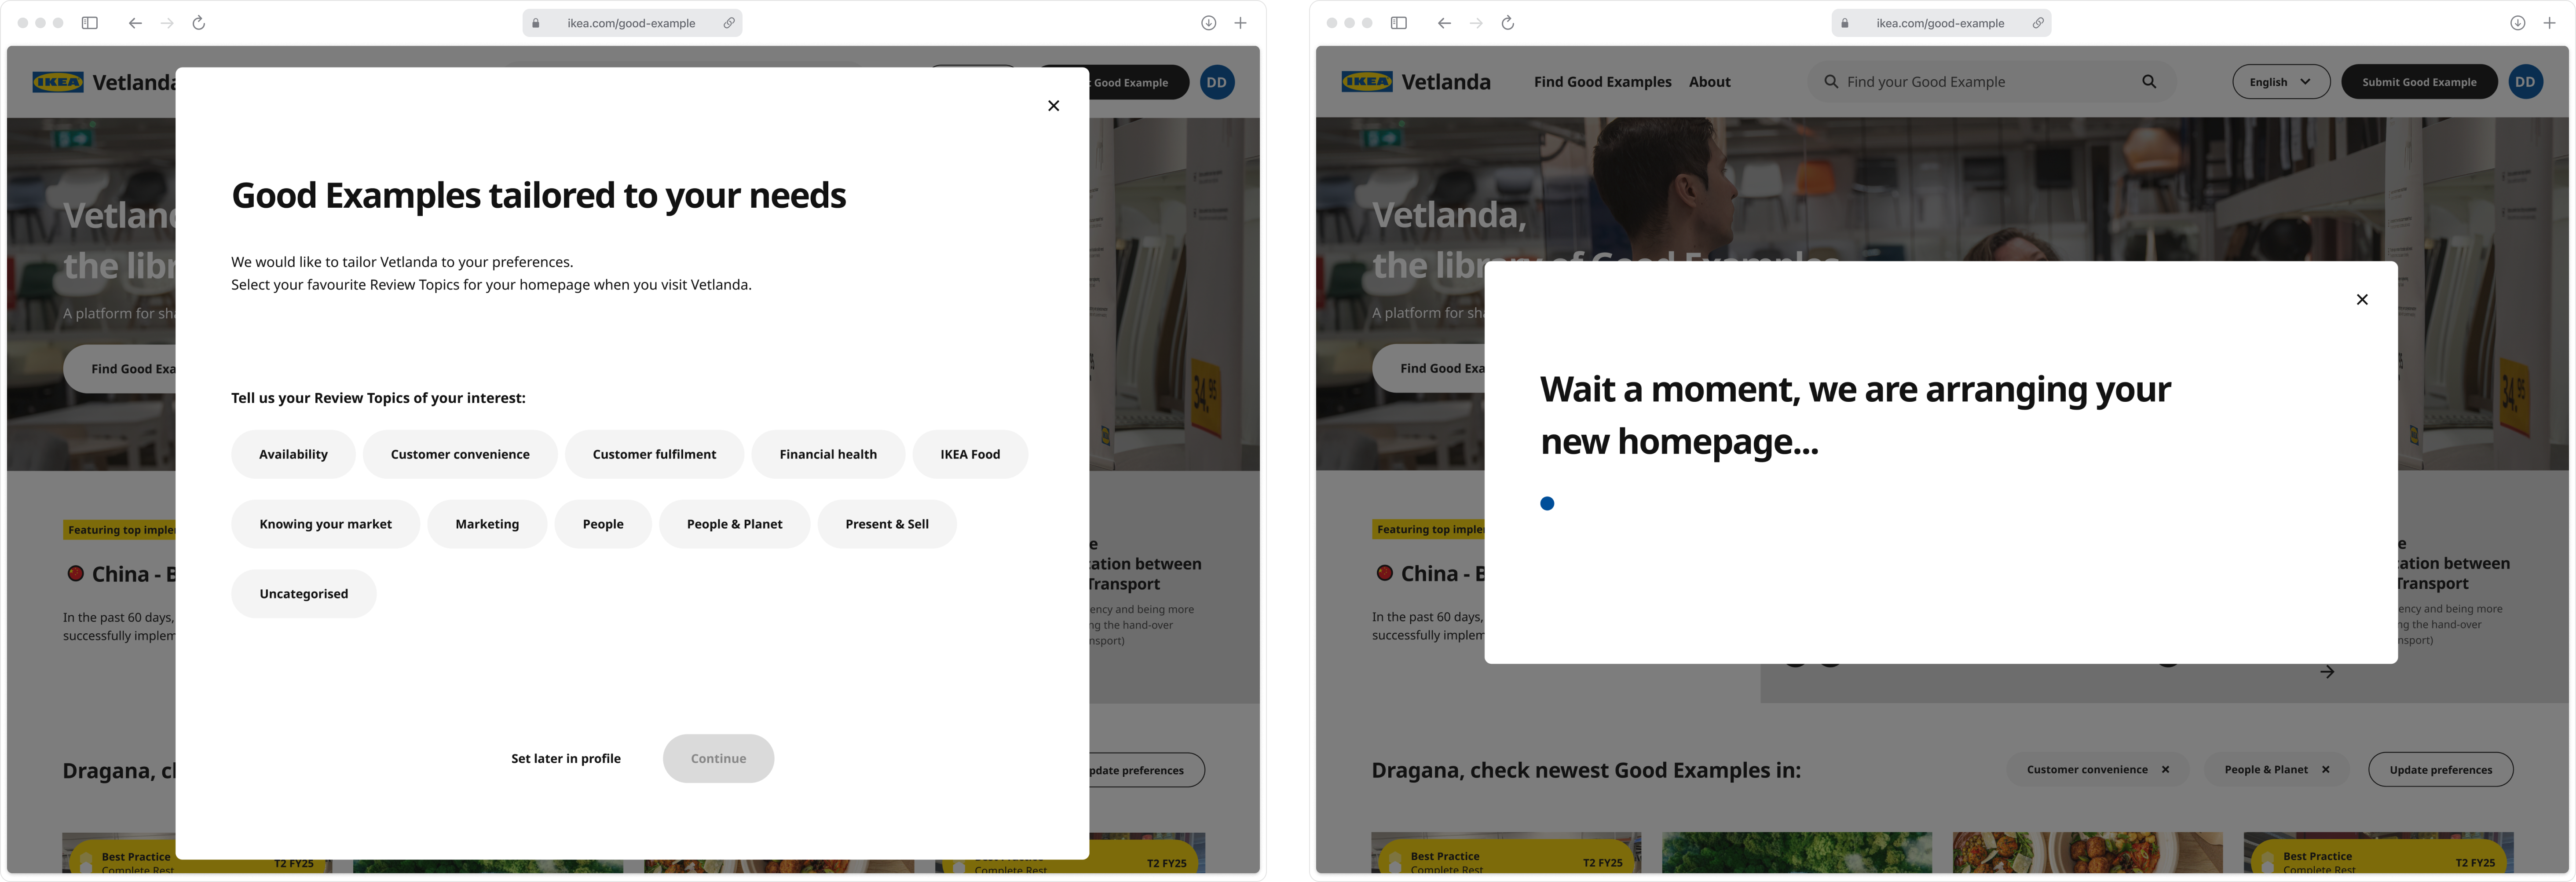
Using Google Analytics, we analysed quantitative data to understand user behaviour, including how users navigated the mega menu search. We then divided our efforts into several key areas. One of our main goals was to introduce a personalised experience. After identifying usage patterns, we realised that employees work in different departments and, when visiting Vetlanda, they typically look for improvements relevant to their own area.
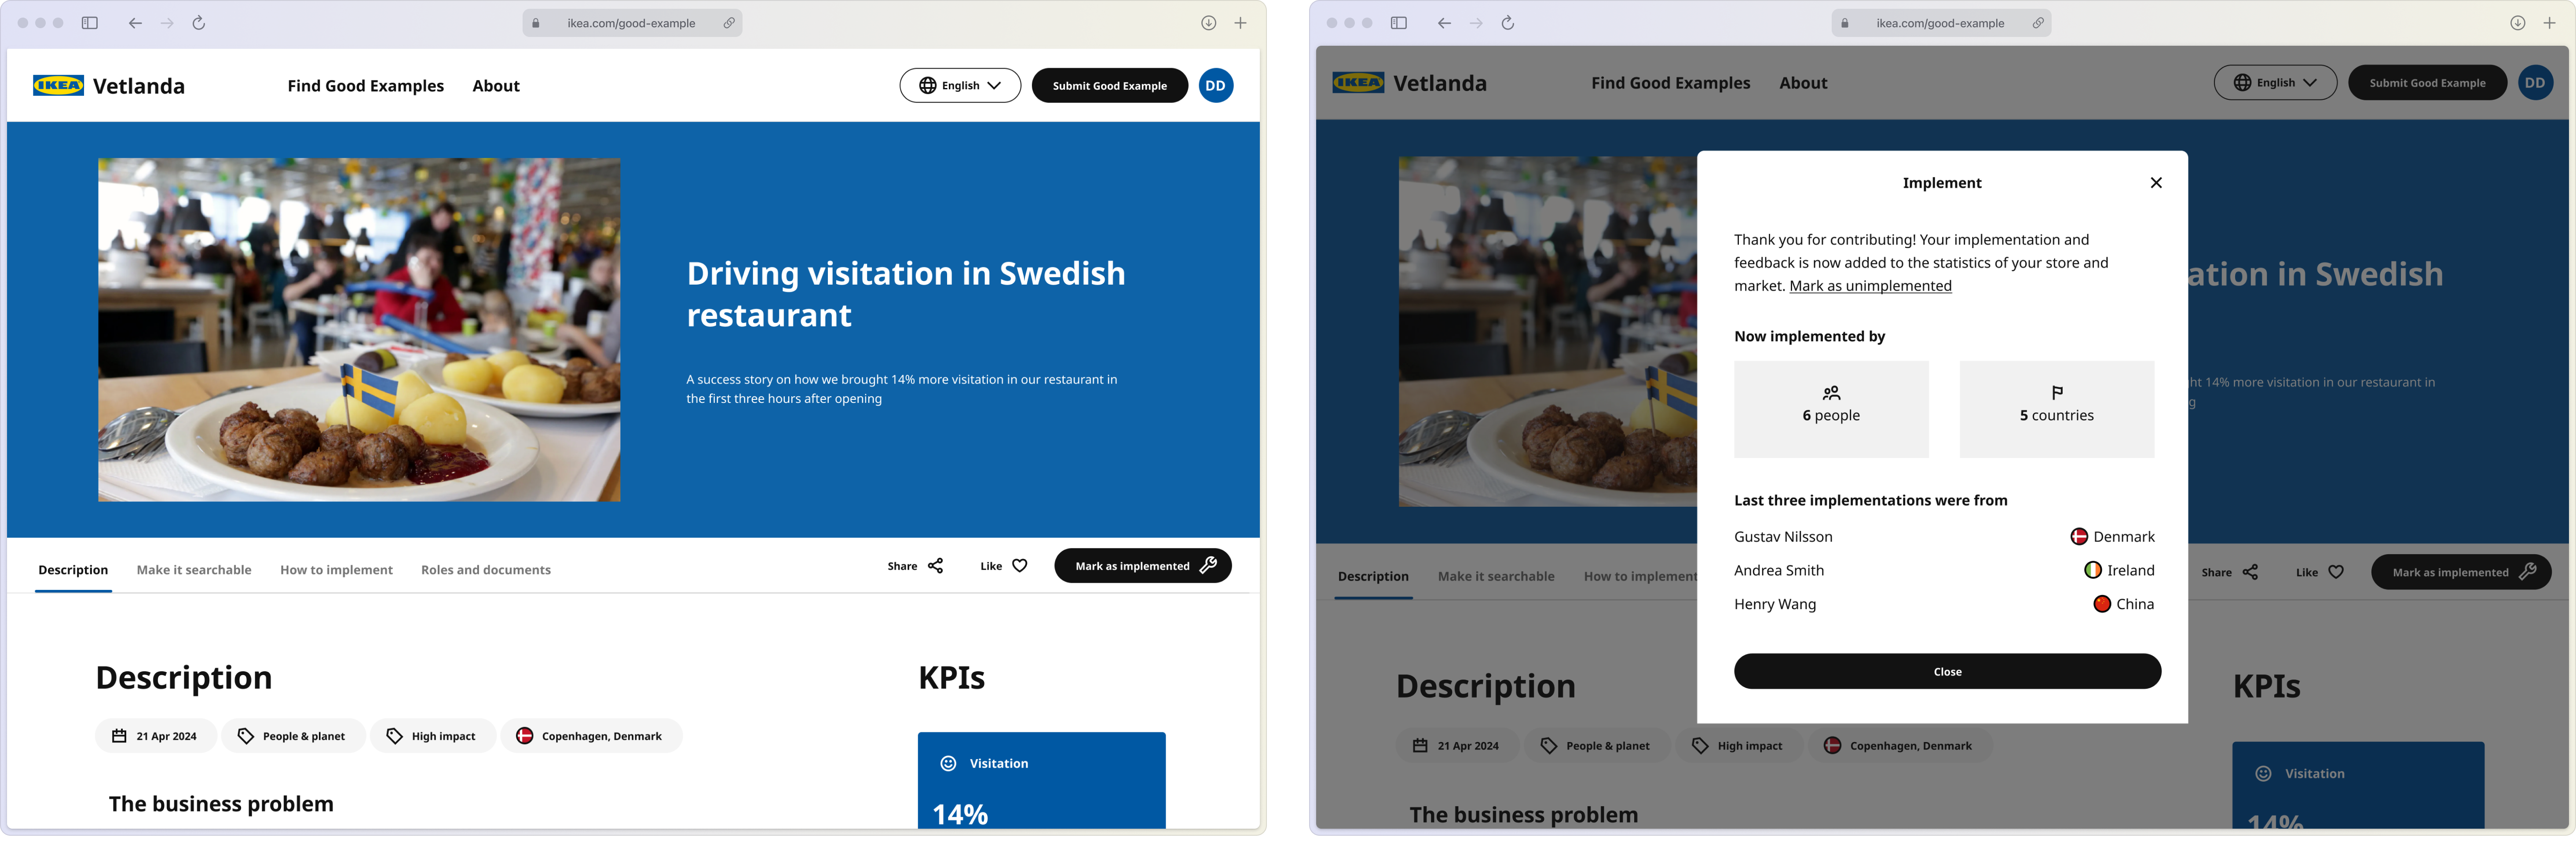
Alongside making Vetlanda more personalised for store employees, we also began focusing on collecting information about the implementation of improvements (in progress). We started by researching and prototyping ways to store this information without making it cumbersome for users to input data. In first iterations we introduced a button on the Good Example page labelled . This allowed us to begin gathering data on how many and which employees had implemented each example.
Initially, we used a manual method to retrieve this information. While we could see how many times each Good Example had been implemented and by whom, we lacked detailed data. To calculate percentages, we had to contact store employees directly and compile the figures ourselves.Looking ahead, we are developing an implementation flow that will allow users to submit this information more easily.
With the help of AI, we plan to calculate how much profit each Good Example generates based on the number of implementations.
Our first step towards personalisation was introducing a flow that allowed users to select their preferred review topics. Each time they visited the platform, the latest and most relevant improvements from their chosen topics would appear, making it easier for them to find what they needed.
After implementing this button, we went through several iterations to optimise its functionality. When presenting the importance of calculating KPIs to stakeholders, we manually reached out to the employees who had marked specific Good Examples as implemented and asked them about their results. This process was repeated for all employees who had marked a particular improvement as implemented.T
Through this approach, we were able to obtain a good estimate of, for example, how much profit an individual implementation had generated. We have now verified a substantial number of implementations, and in the future we plan to use AI to efficiently display, for each Good Example, the calculated KPIs across all countries.
We have manually calculated that the average number of implementations have risen for 27% after introducing the methods above.