Elkjøp's customer support costs had risen sharply through the pandemic. I led design across the most expensive contact channel — phone support — and the most public one — the help pages.
My role
My job was to turn call drivers into self-service products fast enough to bend the cost curve before the next peak season.
The work spanned four Nordic markets and required close collaboration with a product owner, engineers, and business analysts. The team's mission was clear: stop asking "how do we answer more calls?" and start asking "which calls should we never receive?"
Problem statement
Pandemic-era online order volume had outpaced the call centre capacity. Phone queues stretched, email response times slipped, and a meaningful share of customers relied to in-store visits to resolve issues that should have been handled remotely.

The operational fix was obvious: to staff up. But he strategic question was harder: which categories of contact were structurally avoidable, and which were the support org's actual job?
I framed the work around the second question. Adding headcount would absorb the current peak but the cost would rise, as it does not solve the original problem,
Phone was the priority because it was by far the highest unit-cost channel. In an omnichannel environment, reducing phone volume doesn't just save call-centre minutes: it reduces pressure across email, in-store, and chat, because the same underlying problems drive contact across all of them.
Strategy shaping insights
I needed to know what was actually driving inbound contact before designing anything. We ran user surveys via Hotjar across the customer service pages in all four markets and ran co-listening sessions in customer care centres — sitting with agents, hearing how customers described problems, and watching how agents resolved them.
Three categories accounted for the bulk of avoidable volume:
‣ Status of a repair,
‣ Delivery status,
‣ Return status.
The inital thought was to attack delivery first because it had the highest call count.
I argued against it.
Most delivery calls were about customers complaining about third-party carrier issues we couldn't influence. Repair was a smaller share of call volume, and the underlying problem (customers calling for status updates on an internal repair workflow) was something we could fix end-to-end. We chose impact-per-effort over raw volume.
Discovery - what we chose not to build
Creating ownership across the team in building new solutions
I facilitated a cross-functional discovery workshop and we ran the candidates through an impact–effort matrix. Three things survived: a repair-status self-service PWA, a redesigned help hub with surfaced FAQs, and callback functionality for phone support.
A few things didn't survive that are worth naming.
A native mobile app was on the table early. Stakeholders liked the idea: apps feel more "real." I pushed back as the product had to reach customers instantly - at the moment of an in-store repair intake, with no prior install. Anything that required an app download added a step we knew customers wouldn't take in that context. Native lost on friction, not on capability.
An account-gated experience was also proposed, which would have made personalisation easier. I argued for an unauthenticated, link-based entry instead. Anonymous access traded long-term data richness for first-use conversion, and at MVP stage conversion was the thing that mattered.


Callback functionality survived the prioritisation exercise but was deprioritised after scoping — telephony integration was a multi-quarter dependency on a roadmap we didn't control, and the expected deflection rate was lower than the repair PWA's.
Why Sweden first: trade-off
The trade-off was deliberate
We launched the MVP in Sweden, not across all four markets. Launching in one market was a deliberate choice. We learned less about how markets compared, but mistakes stayed small and feedback came back fast.
Sweden had the strongest internal support team for the repair workflow, which mattered because operational mistakes in the first weeks would surface as agent escalations, not just analytics. I accepted that we'd learn less about market variation in exchange for learning more and faster about the product itself.
If I did this again, I'd build the measurement tools in from the start. That way the Sweden launch would have told us not just that calls dropped, but which features did the dropping. More on this in learnings.
Below is a high level visual of our release process:

Why a PWA?
We chose a PWA over a native app and over a pure SMS-thread experience for the following reason
The trigger moment was an SMS sent five to ten minutes after in-store intake. Anything requiring an app store visit at that moment would lose the customer. A PWA opens from a link in one tap, no install.
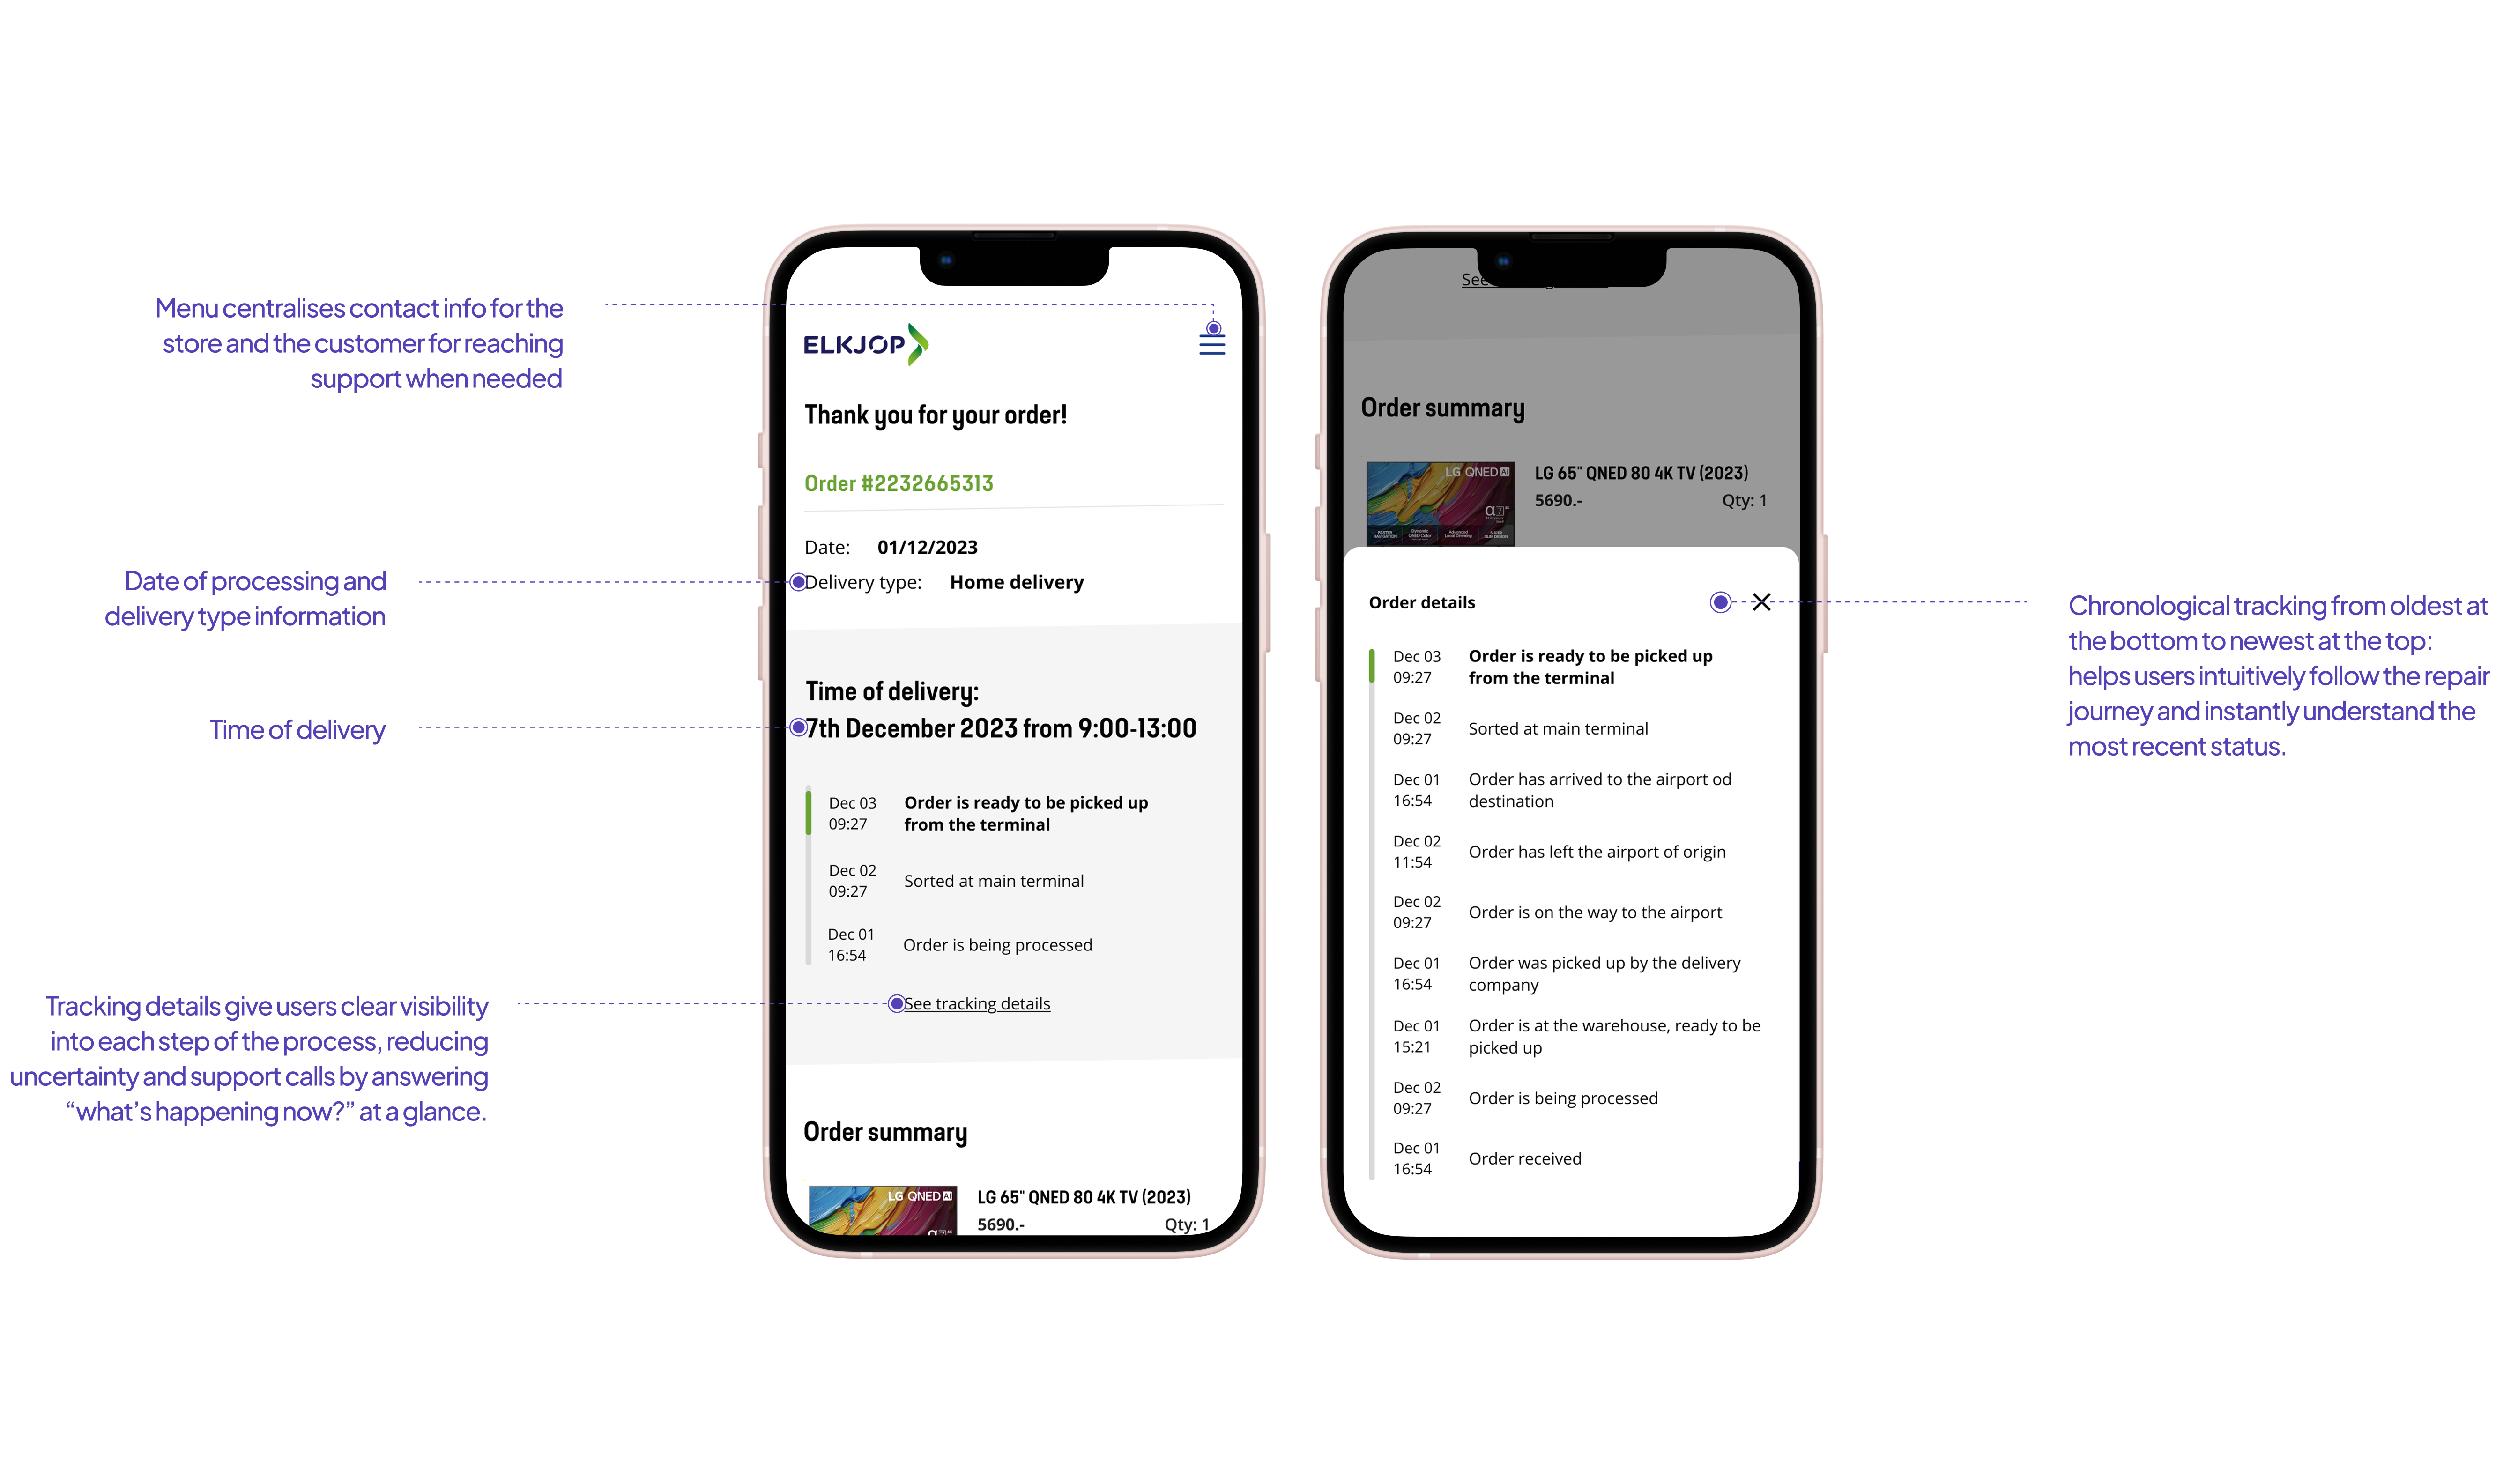
A pure SMS flow was the simplest option and the team's initial preference, but it capped what we could later layer on: the cost estimate flow, the decision tree for high-value items — without re-engineering the whole experience. I argued for the format that gave us the most product surface for the second and third releases, not just the first.
The choice that paid off
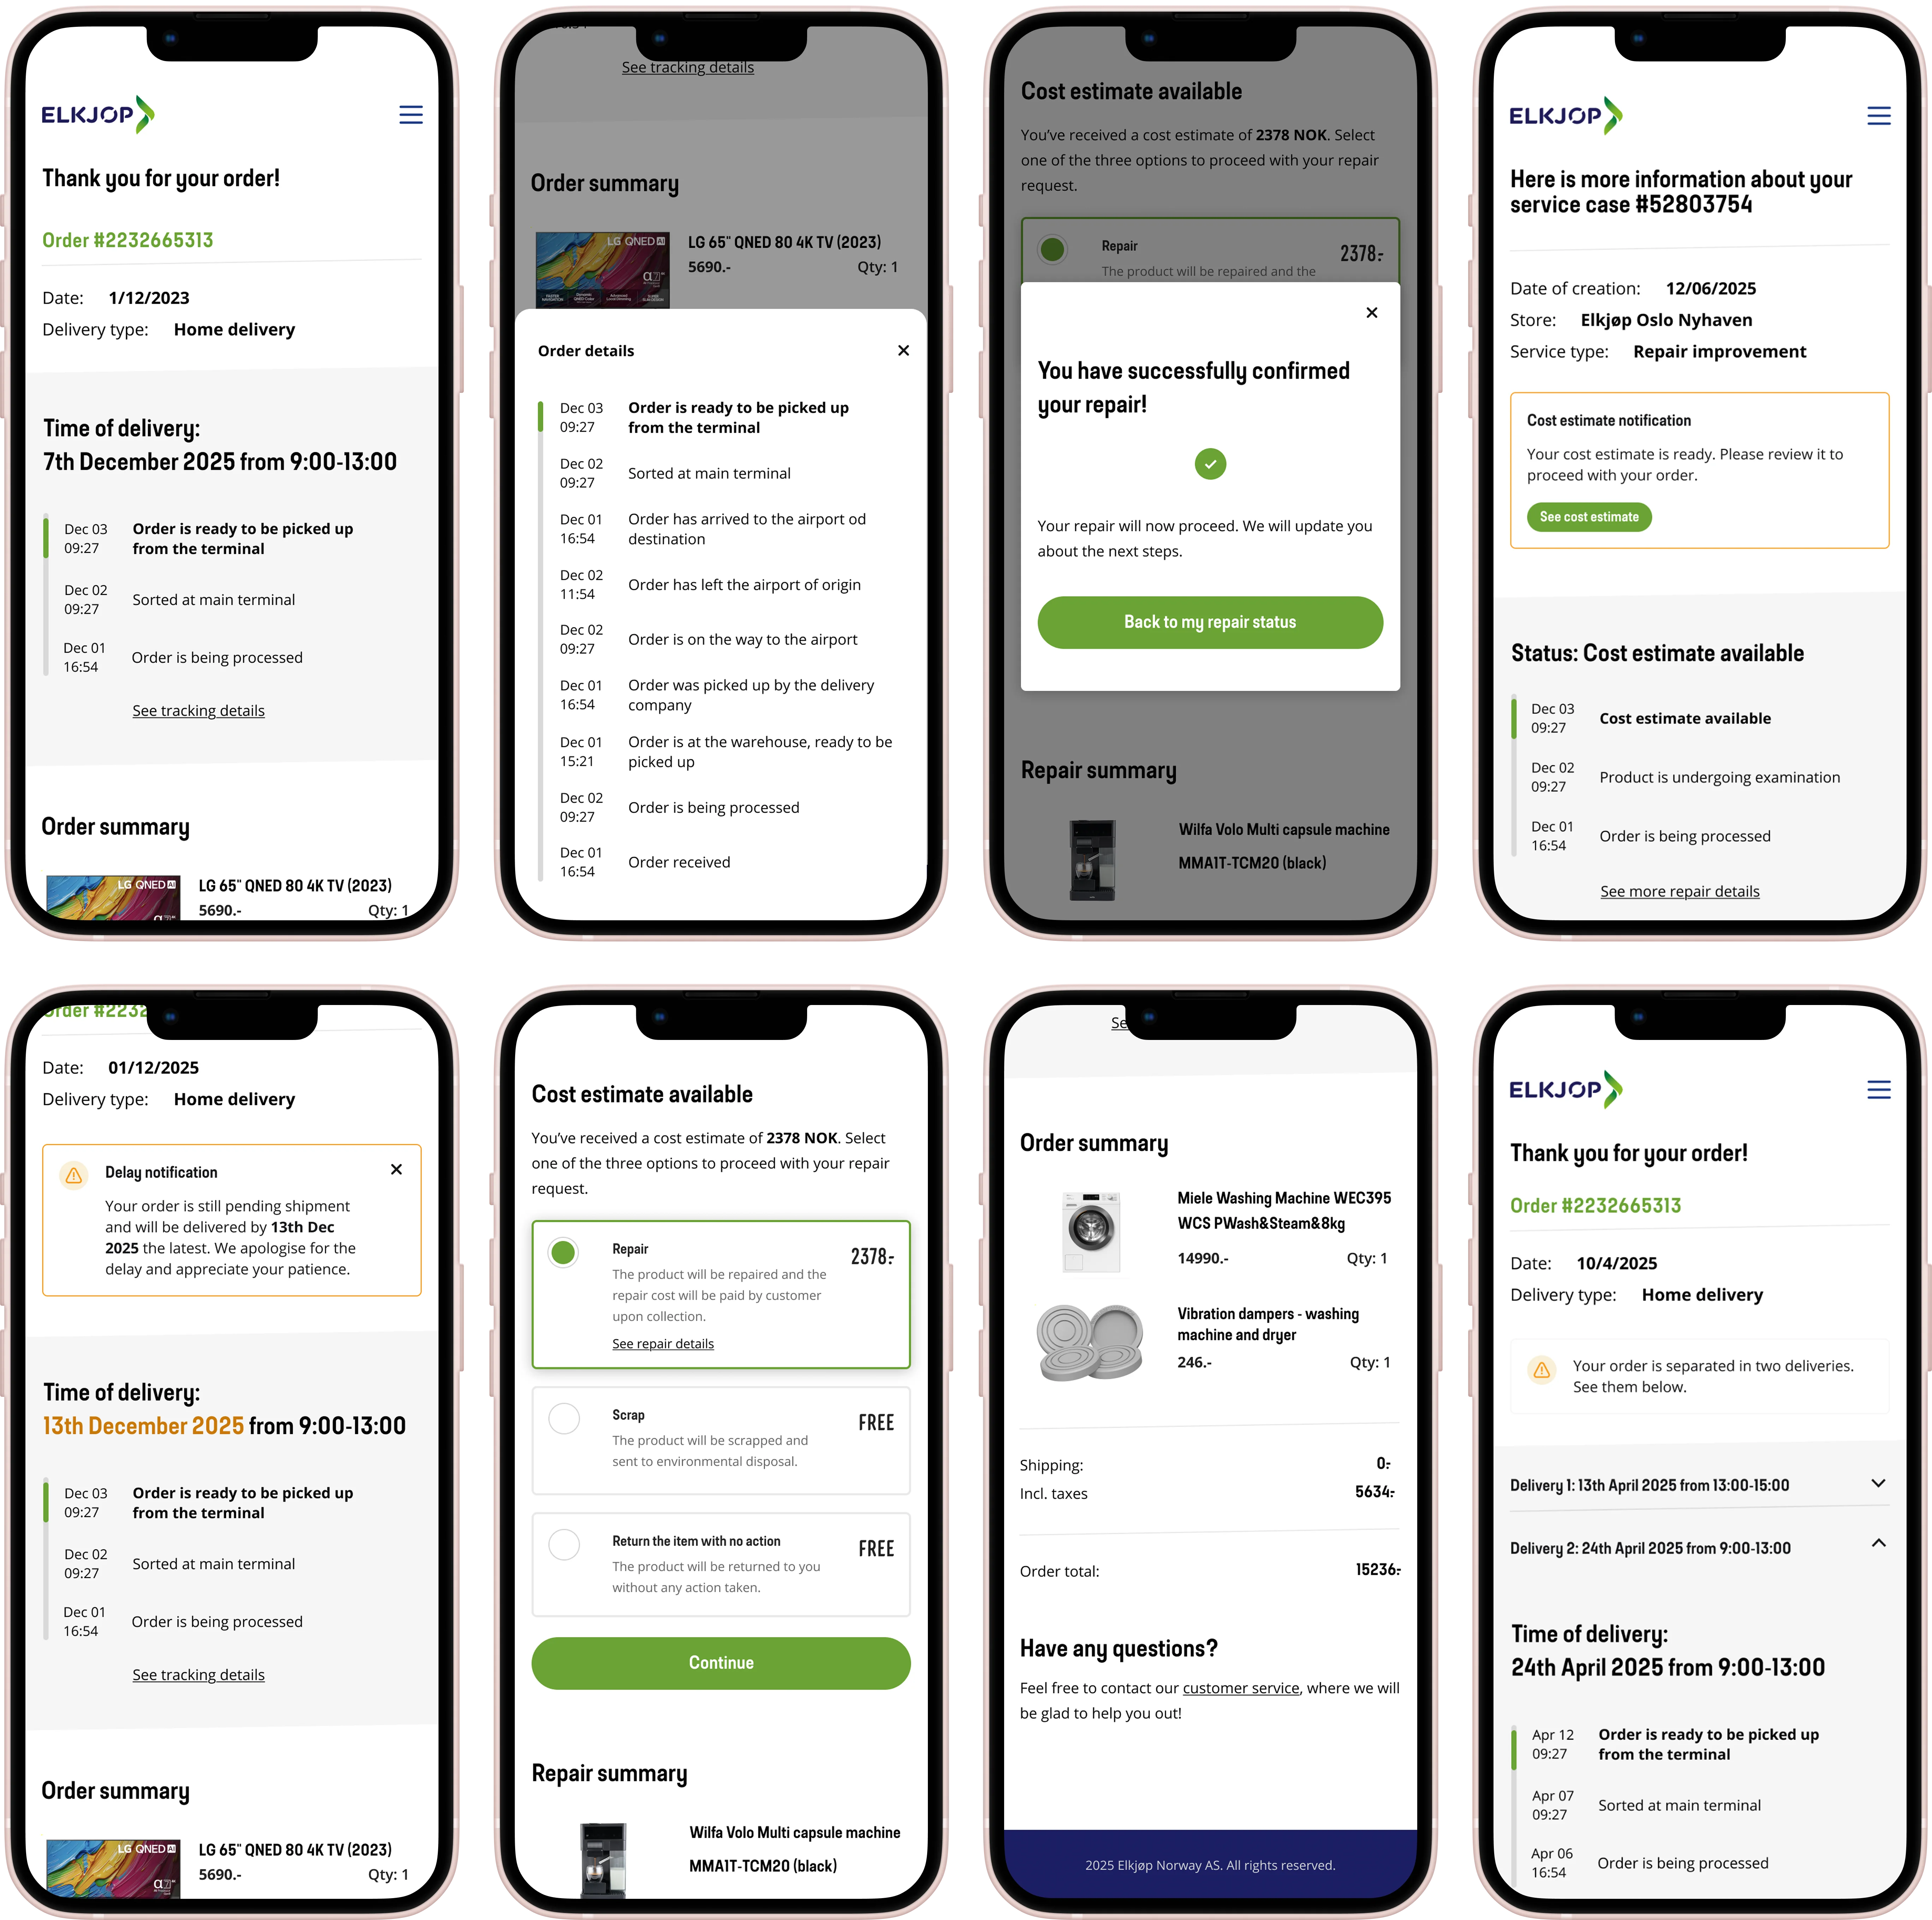
Real-time delay notifications — the bet that paid off
Research showed that most customers called support for a repair status update at around day 5 of waiting. The pattern was tight enough that we could design against it. I proposed proactive status confirmations on day 4 - before the customer felt enough friction to pick up the phone.
There was a real risk in this. Telling customers about a delay before they'd noticed one could create worry that wasn't there. We debated it. But silence was already producing the calls and frustration we were trying to fix — that cost was visible in the data. The cost of saying too much was only a guess. We took the risk.
This decision - proactive day 4 notification combined with on-demand status checking, drove the largest single share of the call reduction.
The cost estimate flow — customer agency vs. channel revenue
Many products brought in for repair are high-value: laptops, TVs, appliances. When a repair quote landed above a customer's mental threshold, they called support — sometimes to negotiate, often just to decide. We added a decision flow inside the PWA giving customers three explicit options when the estimate came in: continue with the repair, scrap the item, or have it returned unrepaired.
This was the trade-off I had to argue hardest for.
Giving customers "scrap" and "return without repair" as clear options meant some would walk away from a repair they might otherwise have agreed to. Real revenue was on the table.
I argued the trade was worth it for two reasons: customers who feel in control come back for the next purchase, and the calls these decisions used to generate were expensive too. The Swedish call drop after launch proved it.
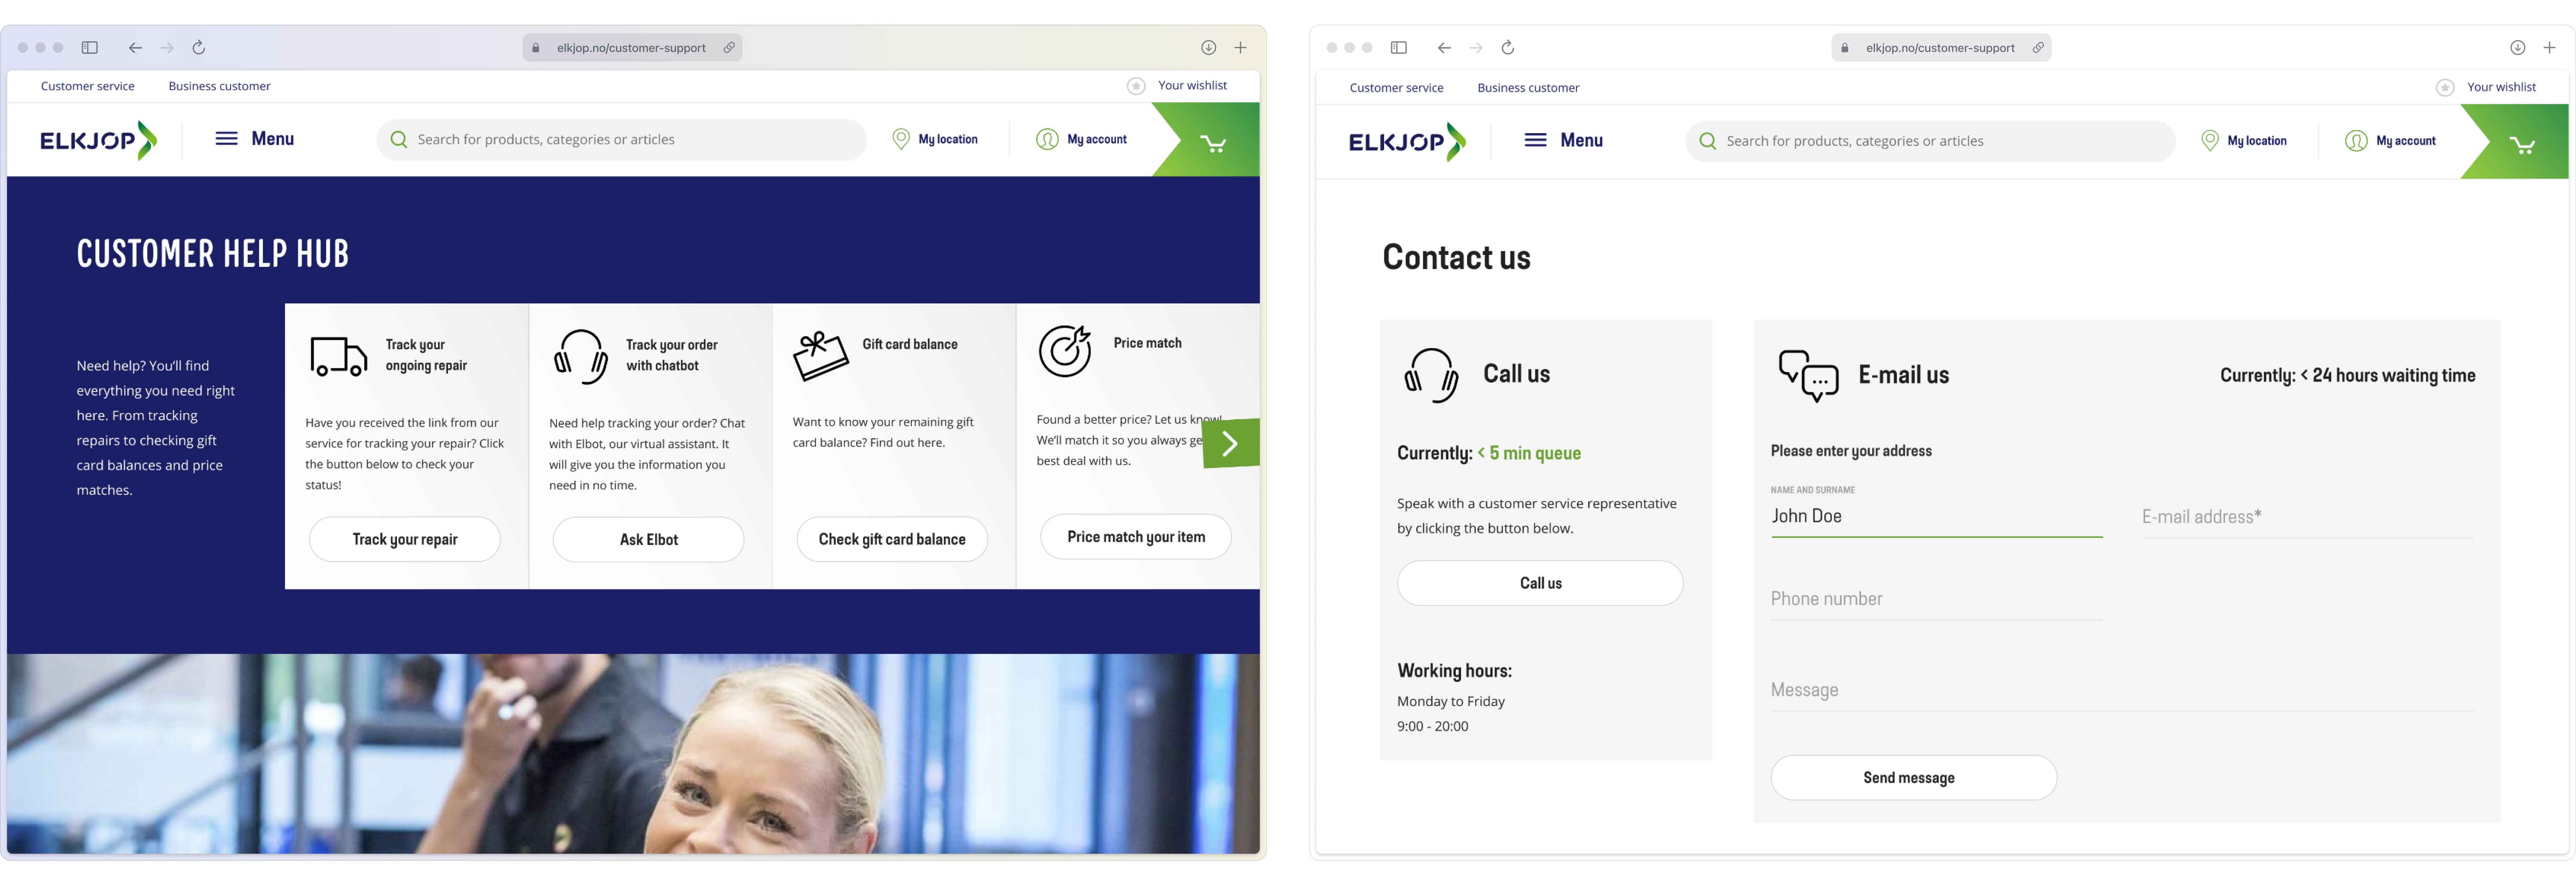
Customer service pages - the parallel front door
Working on customer service pages in parallel
While the repair PWA addressed the highest unit-cost calls, the help hub addressed the highest-volume entry point: the page customers landed on when they didn't know where else to go. I treated these as two halves of the same strategy: cut cost-per-contact in one channel, cut contact-rate at the top of the funnel in the other.
The redesign promoted self-service tools (repair tracker, chatbot, gift card balance, price match) above the fold, surfaced the highest-frequency questions, and exposed real-time channel availability: including wait times and fallback options.
The detail I'm proudest of is operational: when phone queues were congested for multi-day stretches, we dynamically emphasised the chatbot option to shift load. This wasn't a design decision made once and shipped; it was a response surface that customer-support managers and I tuned weekly based on live co-listening sessions.
Outcome
110K support calls cut across four markets. The repair PWA became the model for self-service in other product areas. The help-hub idea - switching highlighted contact options based on live demand - became a standard practice. The bigger shift was in mindset: support stopped trying to answer more calls and started preventing them.
What I'd do differently
We underinvested in instrumentation early.
By MVP launch we had product analytics but no clean way to attribute call deflection to specific PWA features. We knew the aggregate call volume dropped; we couldn't cleanly say *which feature drove how much*. That made the case for further investment harder to make than it should have been. Next time, I'd insist on defining the measurement model — including the proxy for "deflected call" — before the first release, even at the cost of delaying launch by two weeks.
We built Sweden-perfect and then refactored for the other markets.
Each subsequent market launch surfaced assumptions baked into the Sweden build — language, address formats, repair workflow quirks. I'd reverse this: design for the lowest-common-denominator infrastructure first, then layer market-specific behaviour on top. The refactor cost more than the discipline would have.
And the story didn’t end there…
Beyond the solutions presented here, the work included the parts a case study can't capture cleanly: stakeholder disagreements, the bets that didn't land first time, and the trade-offs we made when dev capacity, market priorities, and business pressure pulled in different directions. If you'd like to hear how I navigate that, let's talk.